From SIR to SEIR
Published at Apr 23, 2026
Author: Marvin van Aalst
Building Epidemic Models with mxlpy — From SIR to SEIR Without Starting Over
Compartmental epidemic models are one of the oldest and most widely used tools in public health. The core idea is simple: divide a population into groups — compartments — and write down rules for how people move between them. Despite their simplicity, these models powered pandemic response decisions during COVID-19, influenza outbreaks, and many others.
In this post we will build a family of these models using mxlpy. The point is not just to simulate an epidemic — it is to show how mxlpy lets you start with a simple model and extend it incrementally, without ever rewriting the core from scratch.
The SIR Model
The simplest compartmental model splits a population into three groups:
- S — Susceptible (can catch the disease)
- I — Infected (currently sick and infectious)
- R — Recovered (immune, no longer infectious)
The population flows in one direction: S → I → R.
Two parameters control the dynamics:
| Parameter | Meaning |
|---|---|
beta | Transmission rate — how often a susceptible person becomes infected per contact with an infected person |
gamma | Recovery rate — fraction of infected people who recover per unit time |
The corresponding ODEs are:
dS/dt = -beta * S * I
dI/dt =  beta * S * I - gamma * I
dR/dt =  gamma * I
Building SIR in mxlpy
import numpy as np
import matplotlib.pyplot as plt
from pathlib import Path
from mxlpy import Model, Simulator, fns

ASSETS = Path("dist/assets")
ASSETS.mkdir(parents=True, exist_ok=True)

time = np.linspace(0, 200, 500)
def sir() -> Model:
return (
Model()
.add_variables({"S": 0.99, "I": 0.01, "R": 0.0})
.add_parameters({"beta": 0.3, "gamma": 0.05})
.add_reaction(
"infection",
fn=fns.mass_action_2s,
args=["beta", "S", "I"],
stoichiometry={"S": -1, "I": 1},
)
.add_reaction(
"recovery",
fn=fns.mass_action_1s,
args=["gamma", "I"],
stoichiometry={"I": -1, "R": 1},
)
)A few things to note about the mxlpy API:
- Fluent builder pattern — every
.add_*call returns the model itself, so you can chain them. stoichiometrymaps variable names to the sign of their change.{"S": -1, "I": 1}means: one unit leaves S, one unit enters I.- Rate functions come from
mxlpy.fns.mass_action_2s(k, s1, s2)evaluates tok * s1 * s2, which gives usbeta * S * I.
Simulating and Plotting
variables, fluxes = (
    Simulator(sir()).simulate_time_course(time).get_result().unwrap_or_err()
)

fig_sir, ax = plt.subplots(figsize=(8, 4))
variables.plot(ax=ax)
ax.set_xlabel("Time (days)")
ax.set_ylabel("Fraction of population")
ax.set_title("SIR model")
plt.tight_layout()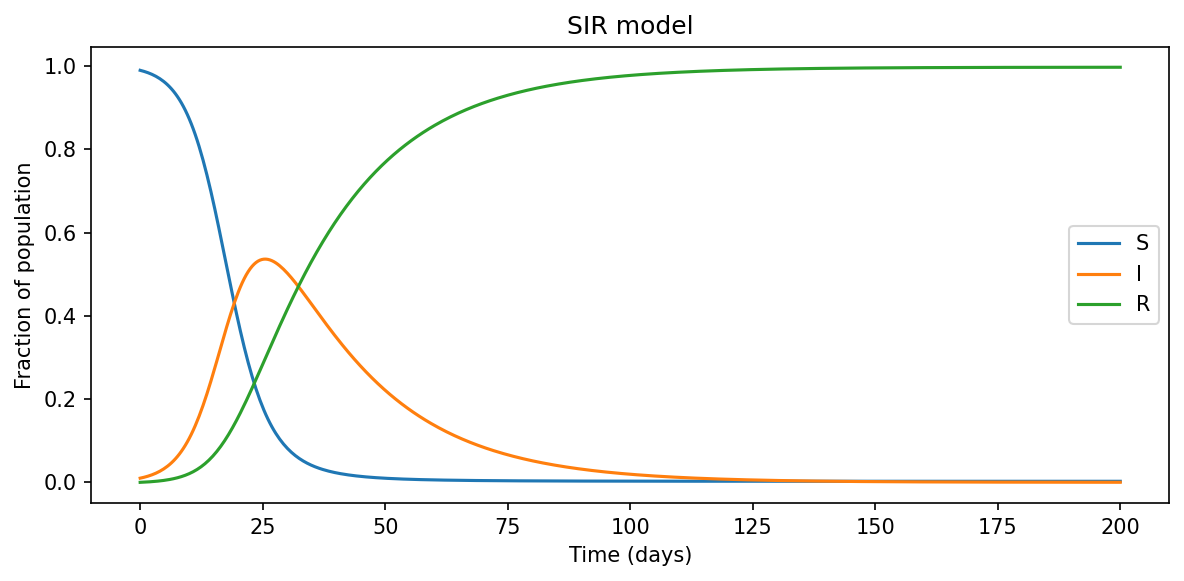
You should see the classic epidemic curve: a wave of infections that rises, peaks, and declines as susceptibles run out and recoveries accumulate.
Extending to SIRD — Adding Disease-Induced Mortality
The SIR model assumes everyone recovers. That is often a reasonable simplification, but sometimes we want to track deaths explicitly. The SIRD model adds a D (Deceased) compartment. Infected individuals now either recover or die:
dS/dt = -beta * S * I
dI/dt =  beta * S * I - gamma * I - mu * I
dR/dt =  gamma * I
dD/dt =  mu * I
Here mu is the disease-induced mortality rate.
Extending the SIR Model
Here is the key insight: we do not rewrite the SIR model. We take the existing model and add what is new.
def sird() -> Model:
    return (
        sir()  # start from SIR
        .add_variable("D", 0.0)  # new compartment
        .add_parameter("mu", 0.005)  # mortality rate
        .add_reaction(
            "death",
            fn=fns.mass_action_1s,
            args=["mu", "I"],
            stoichiometry={"I": -1, "D": 1},
        )
    )
Three lines extend a model that took twelve to write. The infection and recovery dynamics are inherited unchanged. This is the composability that mxlpy is designed for.
variables, fluxes = (
    Simulator(sird()).simulate_time_course(time).get_result().unwrap_or_err()
)

fig_sird, ax = plt.subplots(figsize=(8, 4))
variables.plot(ax=ax)
ax.set_xlabel("Time (days)")
ax.set_ylabel("Fraction of population")
ax.set_title("SIRD model")
plt.tight_layout()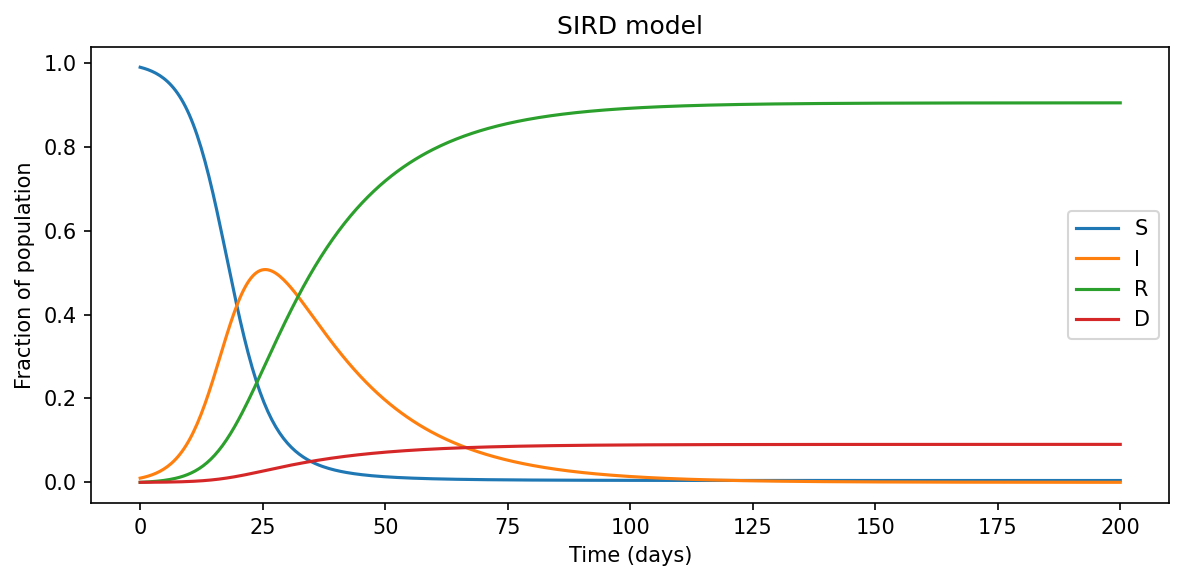
Notice how the recovered population is now slightly lower and the deceased compartment fills in — a small but meaningful distinction for policy planning.
Extending to SEIR — Adding an Incubation Period
Many diseases have an incubation period: infected individuals are not immediately infectious. The SEIR model captures this with an E (Exposed) compartment. Susceptibles first become exposed, then move to infectious:
dS/dt = -beta * S * I
dE/dt =  beta * S * I - sigma * E
dI/dt =  sigma * E - gamma * I
dR/dt =  gamma * I
sigma is the rate of progression from exposed to infectious (1/sigma = mean incubation period).
Extending SIR Again
We go back to the clean SIR model and extend in a different direction.
def seir() -> Model:
    return (
        sir()  # start from SIR
        .add_variable("E", 0.0)  # exposed compartment
        .add_parameter("sigma", 0.1)  # incubation rate
        .update_reaction(
            "infection",
            fn=fns.mass_action_2s,
            args=["beta", "S", "I"],
            stoichiometry={"S": -1, "E": 1},  # now S → E, not S → I
        )
        .add_reaction(
            "progression",
            fn=fns.mass_action_1s,
            args=["sigma", "E"],
            stoichiometry={"E": -1, "I": 1},
        )
    )
.update_reaction() changes only the stoichiometry of the existing infection reaction — the rate law (beta * S * I) is untouched. Exposed individuals then progress to infectious at rate sigma.
variables, fluxes = (
    Simulator(seir()).simulate_time_course(time).get_result().unwrap_or_err()
)

fig_seir, ax = plt.subplots(figsize=(8, 4))
variables.plot(ax=ax)
ax.set_xlabel("Time (days)")
ax.set_ylabel("Fraction of population")
ax.set_title("SEIR model")
plt.tight_layout()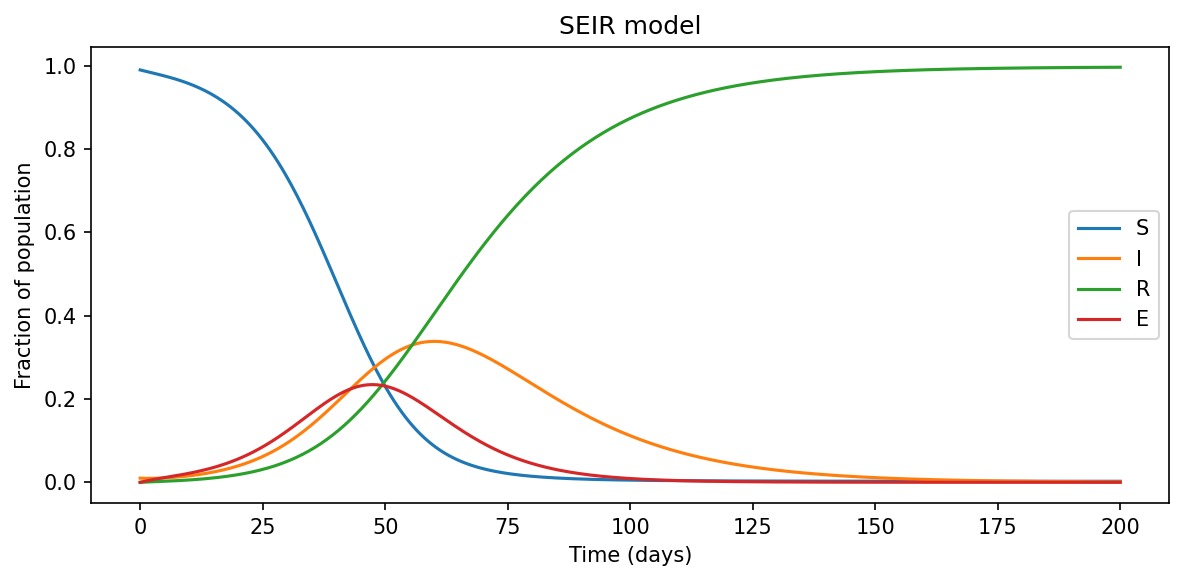
Compared to SIR, the SEIR epidemic peak is delayed and slightly smoothed out — a direct consequence of the incubation lag.
Comparing All Three Side by Side
One practical benefit of building models this way is that all three share the same interface. We can loop over them:
models = {"SIR": sir(), "SIRD": sird(), "SEIR": seir()}

fig_cmp, axes = plt.subplots(1, 3, figsize=(14, 4), sharey=True)

for ax, (name, model) in zip(axes, models.items()):
    variables, _ = (
        Simulator(model).simulate_time_course(time).get_result().unwrap_or_err()
    )
    variables["I"].plot(ax=ax, color="tab:red")
    ax.set_title(name)
    ax.set_xlabel("Time (days)")

axes[0].set_ylabel("Fraction infectious")
plt.tight_layout()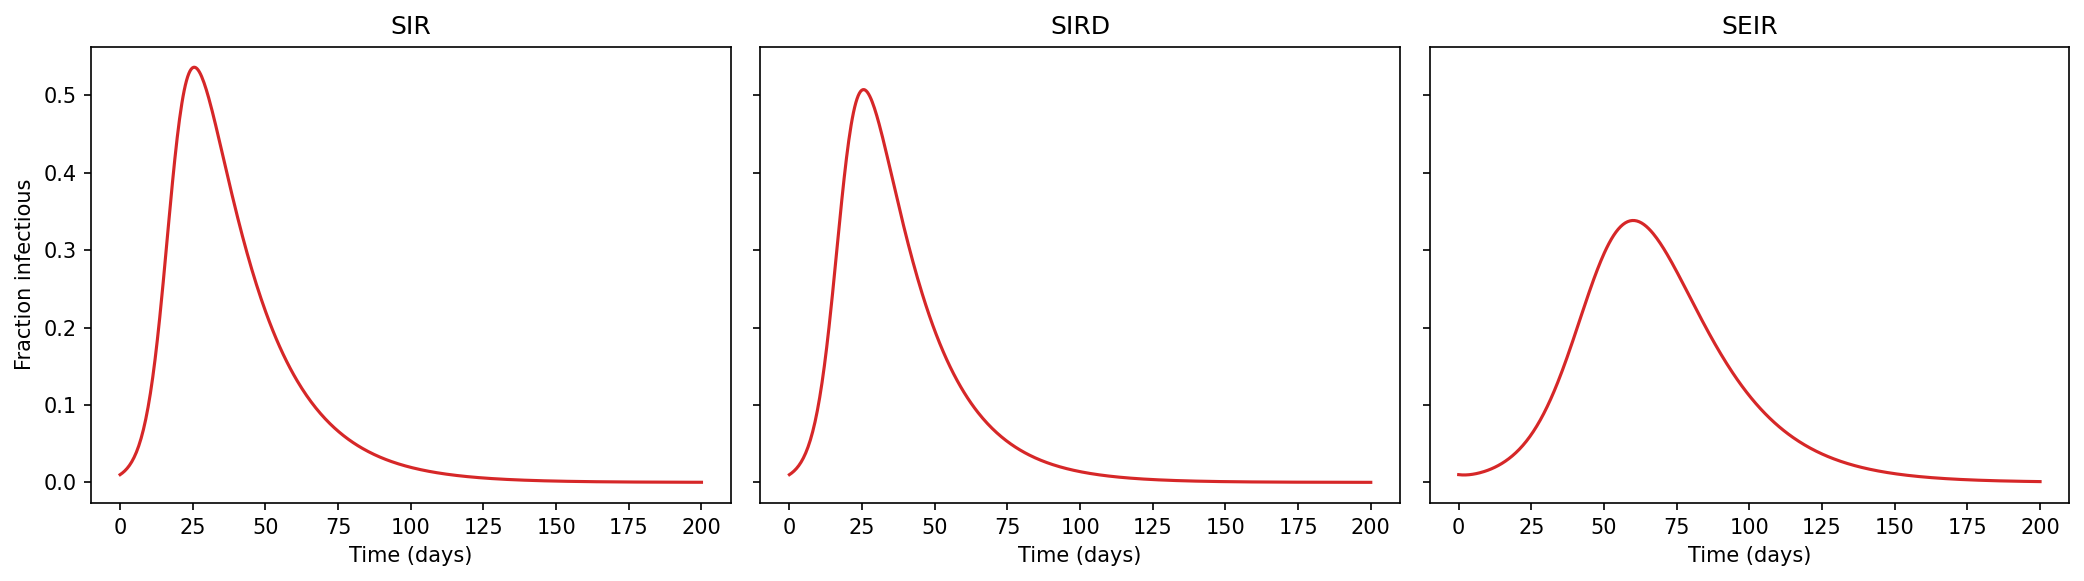
What Did We Actually Do?
We built three epidemiological models. More importantly, we built them as a family:
- SIR is the core — defined once, cleanly.
- SIRD extends SIR by adding a mortality branch.
- SEIR extends SIR by inserting an incubation stage.
Neither extension required touching the shared logic. In a traditional script-based workflow you would copy-paste the equations and risk introducing inconsistencies. Here, the shared structure is inherited and the differences are explicit.
This is the pattern mxlpy encourages throughout: define the simplest correct version, then extend rather than rewrite.
Next Steps
- Try combining the extensions: build a SEIRD model (incubation + mortality) by extending
seir(). - Vary
betaandgammato explore the basic reproduction number R₀ = beta / gamma and its role in determining whether an epidemic takes off. - In a future post we will fit these parameters to real outbreak data using mxlpy’s parameter estimation tools.