Numerical parameter identifiability
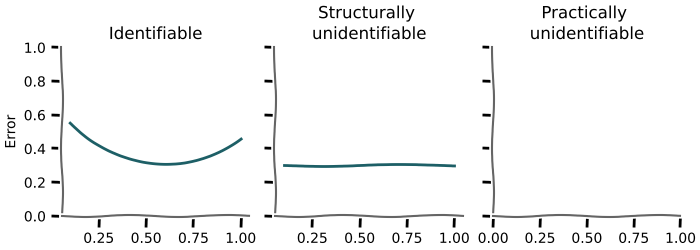
See the course by Marisa Eisenberg for an excellent introduction into the topic
In [1]:
Copied!
import numpy as np

from mxlpy import Model, Simulator, fns, plot
from mxlpy.identify import profile_likelihood
import numpy as np
from mxlpy import Model, Simulator, fns, plot
from mxlpy.identify import profile_likelihood
We start with an SIR model, which we use to generate some data (this would usually be experimentally measured data)
In [2]:
Copied!
def sir() -> Model:
    return (
        Model()
        .add_variables({"s": 0.9, "i": 0.1, "r": 0.0})
        .add_parameters({"beta": 0.2, "gamma": 0.1})
        .add_reaction(
            "infection",
            fns.mass_action_2s,
            args=["s", "i", "beta"],
            stoichiometry={"s": -1, "i": 1},
        )
        .add_reaction(
            "recovery",
            fns.mass_action_1s,
            args=["i", "gamma"],
            stoichiometry={"i": -1, "r": 1},
        )
    )


data = Simulator(sir()).simulate(100).get_result().unwrap_or_err().variables
_ = plot.lines(data)
def sir() -> Model:
return (
Model()
.add_variables({"s": 0.9, "i": 0.1, "r": 0.0})
.add_parameters({"beta": 0.2, "gamma": 0.1})
.add_reaction(
"infection",
fns.mass_action_2s,
args=["s", "i", "beta"],
stoichiometry={"s": -1, "i": 1},
)
.add_reaction(
"recovery",
fns.mass_action_1s,
args=["i", "gamma"],
stoichiometry={"i": -1, "r": 1},
)
)
data = Simulator(sir()).simulate(100).get_result().unwrap_or_err().variables
_ = plot.lines(data)

We then, for n different values of each parameter we are interested in, we
- draw random samples for the remaining model parameters
- fit the model to the data (excluding the parameter we are interested in) and note the final error
- visualise the error for each parameter value
The error for a parameter should show a clear minimum around the different values used, otherwise it is not identifiable
In [3]:
Copied!
errors_beta = profile_likelihood(
    sir(),
    data=data,
    parameter_name="beta",
    parameter_values=np.linspace(0.2 * 0.5, 0.2 * 1.5, 10),
    n_random=10,
)

fig, ax = plot.lines(errors_beta, legend=False)
ax.set(title="beta", xlabel="parameter value", ylabel="abs(error)")
plot.show()
errors_beta = profile_likelihood(
sir(),
data=data,
parameter_name="beta",
parameter_values=np.linspace(0.2 * 0.5, 0.2 * 1.5, 10),
n_random=10,
)
fig, ax = plot.lines(errors_beta, legend=False)
ax.set(title="beta", xlabel="parameter value", ylabel="abs(error)")
plot.show()
beta: 0%| | 0/10 [00:00<?, ?it/s]
beta: 10%|█ | 1/10 [00:03<00:33, 3.68s/it]
beta: 20%|██ | 2/10 [00:07<00:29, 3.73s/it]
beta: 30%|███ | 3/10 [00:11<00:25, 3.69s/it]
beta: 40%|████ | 4/10 [00:14<00:22, 3.68s/it]
beta: 50%|█████ | 5/10 [00:18<00:18, 3.67s/it]
beta: 60%|██████ | 6/10 [00:21<00:14, 3.64s/it]
beta: 70%|███████ | 7/10 [00:25<00:10, 3.58s/it]
beta: 80%|████████ | 8/10 [00:29<00:07, 3.68s/it]
beta: 90%|█████████ | 9/10 [00:33<00:03, 3.76s/it]
beta: 100%|██████████| 10/10 [00:37<00:00, 3.81s/it]
beta: 100%|██████████| 10/10 [00:37<00:00, 3.72s/it]
