Dynamic Enterobactin model

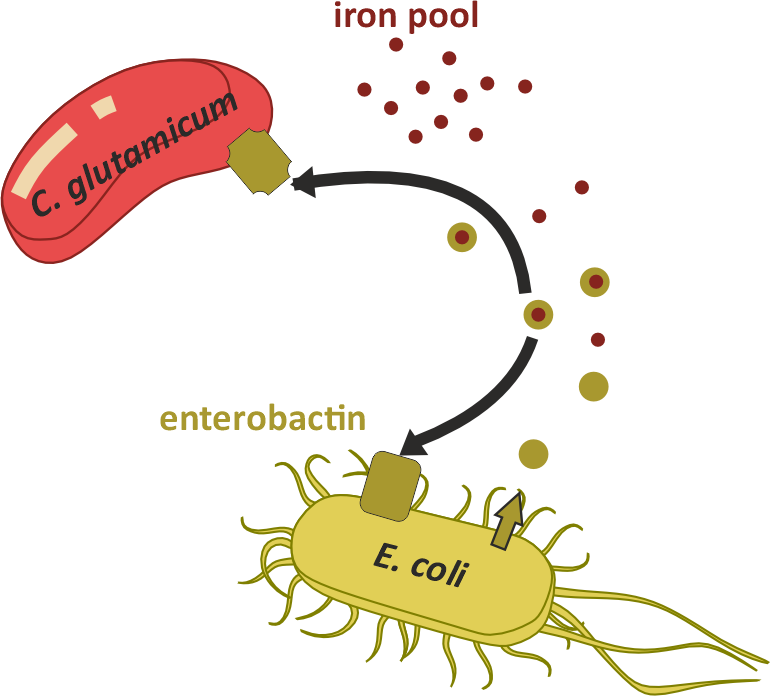
Iron is essential to almost every organism, yet under aerobic conditions it is mostly locked up as poorly soluble ferric iron. Many microbes overcome this by secreting siderophores, small, high-affinity metabolites that chelate ferric iron and deliver it back through dedicated uptake receptors. Because siderophore synthesis is metabolically costly, whether a given siderophore acts as a shared public good, a privatized resource or a competitive weapon depends on who else in the community can access it. This model, developed within the SFB MibiNet community, focuses on enterobactin, the catecholate siderophore with the highest known iron affinity, secreted by E. coli under iron limitation.
C. glutamicum does not produce any siderophores of its own, but carries a broad repertoire of receptors that let it scavenge xenosiderophores made by other organisms, including enterobactin. In this synthetic pairwise community, E. coli is the enterobactin producer and C. glutamicum the exploiter: it accesses the iron E. coli has captured without paying the biosynthetic cost, making enterobactin a public good. Experiments (dose-response assays, single-cell microfluidics, and an enterobactin-receptor affinity biosensor) showed that this exploitation is constrained rather than runaway, co-cultures reproducibly converge to a stable composition instead of collapsing, consistent with E. coli retaining privileged access to the siderophore it produces via its dedicated FepA receptor.
The model tracks four state variables: the two organisms' biomasses, a shared glucose substrate and extracellular enterobactin with double-Monod growth kinetics that require both substrate and siderophore simultaneously. Enterobactin is produced only by E. coli, while both organisms take it up at a growth-coupled rate; the balance between production and consumption sets how much enterobactin remains available to be shared.
Simulation parameters
Analyses
Time course
Loading chart...
Inoculation ratio scan
Add analysis
Model Details
Review and edit model structure, biological variables, and kinetic parameters.
| Name | Tex name | Initial value | Actions |
|---|---|---|---|
Edit Options
Edit Options
Edit Options
Edit Options
Eq Editor
Build an expression by selecting a node and replacing it with a MathML element, then adjust symbols to the allowed variable names.
Arithmetic
Functions
Trigonometry
Hyperbolic
Comparison
Logic
Tip: click any element to select it, then choose a MathML element above or adjust its value. Click the surrounding canvas to wrap the whole expression in a new element. Drag any element onto another to move it there; Ctrl+Z / Ctrl+Shift+Z undo and redo.
Generated LaTeX Code
\begin{align*}
  \frac{d \text{E. coli}}{dt} &= \text{E. coli} \cdot \frac{mu_{max,\ E.\ coli} \cdot \text{Enterobactin} \cdot \text{Glucose}}{(K_{s,\ Glucose,\ E.\ coli} + \text{Glucose}) \cdot (K_{s,\ Enterobactin,\ E.\ coli} + \text{Enterobactin})} \\
  \frac{d \text{C. Glutamicum}}{dt} &= \text{C. Glutamicum} \cdot \frac{mu_{max,\ C.\ glutamicum} \cdot \text{Enterobactin} \cdot \text{Glucose}}{(K_{s,\ Glucose,\ C.\ Glutamicum} + \text{Glucose}) \cdot (K_{s,\ Enterobactin,\ C.\ Glutamicum} + \text{Enterobactin})} \\
  \frac{d \text{Glucose}}{dt} &= - \frac{\text{E. coli}}{Y_{E.\ coli,\ Glucose}} \cdot \frac{mu_{max,\ E.\ coli} \cdot \text{Enterobactin} \cdot \text{Glucose}}{(K_{s,\ Glucose,\ E.\ coli} + \text{Glucose}) \cdot (K_{s,\ Enterobactin,\ E.\ coli} + \text{Enterobactin})} \\
  & - \frac{\text{C. Glutamicum}}{Y_{C.\ glutamicum,\ Glucose}} \cdot \frac{mu_{max,\ C.\ glutamicum} \cdot \text{Enterobactin} \cdot \text{Glucose}}{(K_{s,\ Glucose,\ C.\ Glutamicum} + \text{Glucose}) \cdot (K_{s,\ Enterobactin,\ C.\ Glutamicum} + \text{Enterobactin})} \\
  \frac{d \text{Enterobactin}}{dt} &= \text{E. coli} \cdot \frac{mu_{E.\ coli} \cdot q_{Enterobactin\ production\ max}}{mu_{max,\ E.\ coli}} \\
  & - \text{E. coli} \cdot \frac{mu_{E.\ coli} \cdot q_{Enterobactin\ uptake\ E.\ coli\ max}}{mu_{max,\ E.\ coli}} \\
  & - \text{C. Glutamicum} \cdot \frac{mu_{C.\ Glutamicum} \cdot q_{Enterobactin\ uptake\ C.\ Glutamicum\ max}}{mu_{max,\ C.\ glutamicum}}
\end{align*}
Fit to data
Fit settings
| Setting | Value |
|---|---|
| Fit backend | |
| Function evaluations per progress update | |
| Maximum total function evaluations | |
| Stop once residual norm reaches |
Curriculum learning (advanced)
Every bar shares one fixed step budget. Drag a divider to move a cutoff, drag a bar's top edge (or focus it and use the arrow keys) to change its share — the final stage isn't draggable, it always gets whatever's left. Double-click a bar or use its + to split it, use a divider's × (or Delete/Backspace while it's focused) to remove it.
| Stage | Data cutoff | Iteration budget |
|---|---|---|
| 1 (final) | full data | 1000 iterations (runs to convergence within this) |
Data
Plot options
| Parameter | Fit | Log-space | Initial guess / fixed value | Fitted value |
|---|---|---|---|---|
| Y_e_coli_glucose | — | |||
| Y_c_glutamicum_glucose | — | |||
| E. coli max. growth rate | — | |||
| C. glutamicum max. growth rate | — | |||
| K_s_glucose_e_coli | — | |||
| K_s_glucose_c_glutamicum | — | |||
| q_enterobactin_production_max | — | |||
| q_enterobactin_uptake_e_coli_max | — | |||
| q_enterobactin_uptake_c_glutamicum_max | — | |||
| K_s_enterobactin_e_coli | — | |||
| K_s_enterobactin_c_glutamicum | — | |||
| inoculation_ratio | — |